TL;DR:
- Gold anomalies are spatially coherent zones of elevated concentrations indicating potential mineralization.
- Detection relies on systematic sampling, sensitive assays, and AI tools to identify subtle signals.
- Combining geochemical data with geological context and AI analysis enhances prospecting accuracy.
A few parts per billion of gold in the wrong place means nothing. Those same readings clustered together across 600 meters of greenstone belt terrain? That's how major Australian gold discoveries begin. Most prospectors focus on what they can see at the surface, but the real action happens in the data, specifically in subtle, spatially coherent elevations in geochemical samples that traditional methods often miss. AI is changing what's detectable and, by extension, what's findable. This guide walks you through what gold anomalies actually are, how detection thresholds work in Australian conditions, how to interpret what you find, and how to turn that knowledge into a sharper, more targeted prospecting strategy.
Table of Contents
- What is a gold anomaly?
- How gold anomalies are detected: Methods and data thresholds
- Interpreting gold anomalies: Statistical approaches and expert insights
- Applying gold anomaly knowledge: Prospecting strategies for Australian goldfields
- Why AI-powered anomaly detection is a game changer
- Take your gold anomaly detection to the next level
- Frequently asked questions
Key Takeaways
| Point | Details |
|---|---|
| Understand gold anomalies | Gold anomalies are areas with elevated gold concentrations that can indicate new deposits. |
| Use precise thresholds | Look for soil values above 25 ppb for anomalies and above 100 ppb for strong targets. |
| Leverage advanced tools | New AI and UltraFine+ techniques detect subtler signals than traditional methods. |
| Interpret with context | Combine statistical, geological, and pathfinder element data for more accurate site selection. |
| Act on coherent anomalies | Large, continuous anomalies verified through modern assays offer the best exploration prospects. |
What is a gold anomaly?
Before you can find gold, you need to understand the signal that points you toward it. In geochemical exploration, a gold anomaly is not just "more gold than usual." It's something far more specific and operationally meaningful.
"A gold anomaly is a spatially coherent zone of elevated gold concentrations in geochemical samples (soil, rock, stream sediment) above local background levels, indicating potential underlying mineralization for prospecting."
The keyword there is spatially coherent. A single elevated reading in one sample is noise. A cluster of elevated readings following a consistent pattern across dozens of samples is a signal worth chasing. That spatial coherence is what separates a real anomaly from a random spike caused by sample contamination, weathering variations, or assay error.
Gold anomalies occur in several sample media, and each tells a different part of the geological story:
- Soil samples (especially B-horizon): The most commonly used medium in Australian exploration. The B-horizon, found directly below the organic topsoil, concentrates gold and pathfinder elements over time through weathering and leaching.
- Stream sediment samples: Useful for broad regional reconnaissance. Anomalous stream sediment readings help identify upstream source areas that justify closer follow-up.
- Rock chip samples: Direct samples from outcrop or float. High gold values in rock chips confirm primary mineralization but don't always reflect broader deposit geometry.
- Lag and soil gas samples: Used in deeply weathered or transported cover terrains where conventional soil sampling underperforms.
Not every anomaly becomes a mine. In fact, most don't. But every significant gold discovery in the Australian goldfields started with someone detecting and then methodically investigating an anomaly. The challenge has always been distinguishing the real signals from the noise, and that's where both systematic methodology and modern AI-driven tools earn their keep.
Understanding how geology and gold finding interact is foundational here. The geology dictates where gold concentrates, and anomalies are the geochemical fingerprint of that concentration. Greenstone belts in Western Australia and Victoria's Bendigo Zone are classic environments where structurally controlled gold deposits generate powerful, persistent anomalies that extend well beyond the ore zone itself. Recognizing that "halo" effect is one of the most practical skills a prospector can develop.
Modern AI tools have made this easier by processing large geochemical datasets and identifying coherent spatial patterns that would take weeks to map manually. The ability to parse subtle, low-amplitude signals from noisy, censored data means anomalies that were previously invisible are now detectable with the right digital platform.
How gold anomalies are detected: Methods and data thresholds
With the definition established, let's examine how gold anomalies are uncovered in practice.
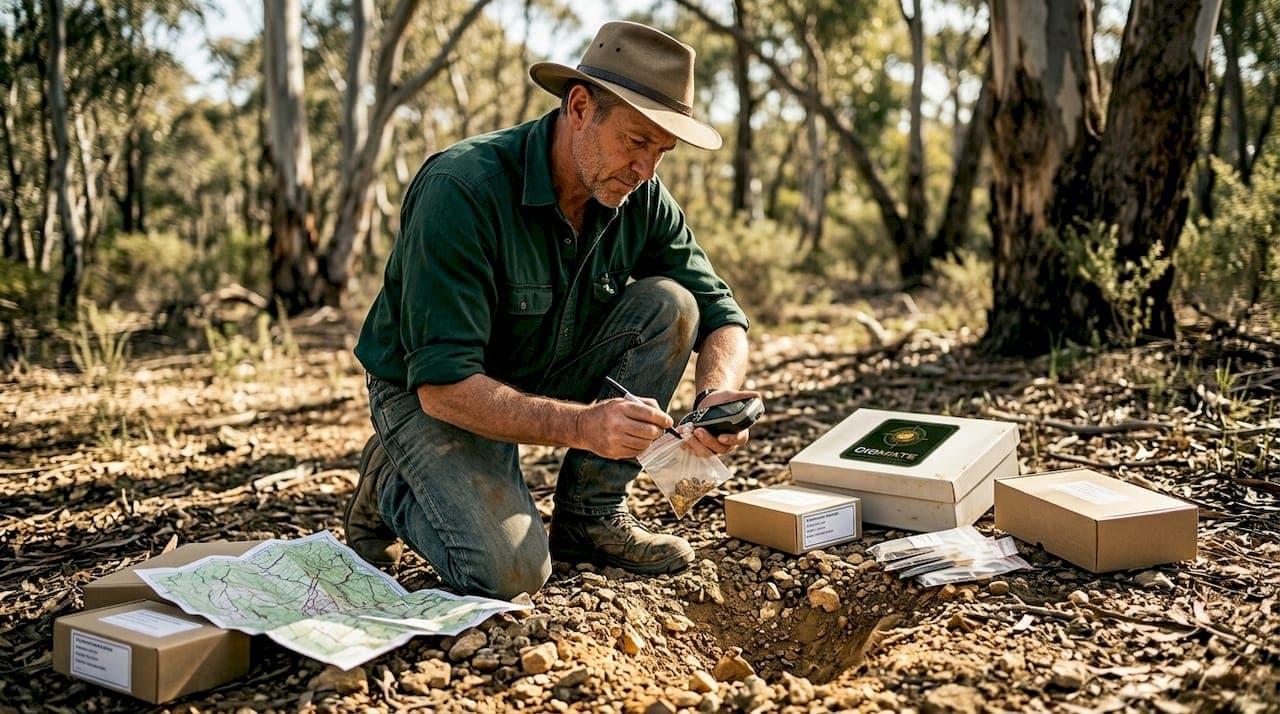
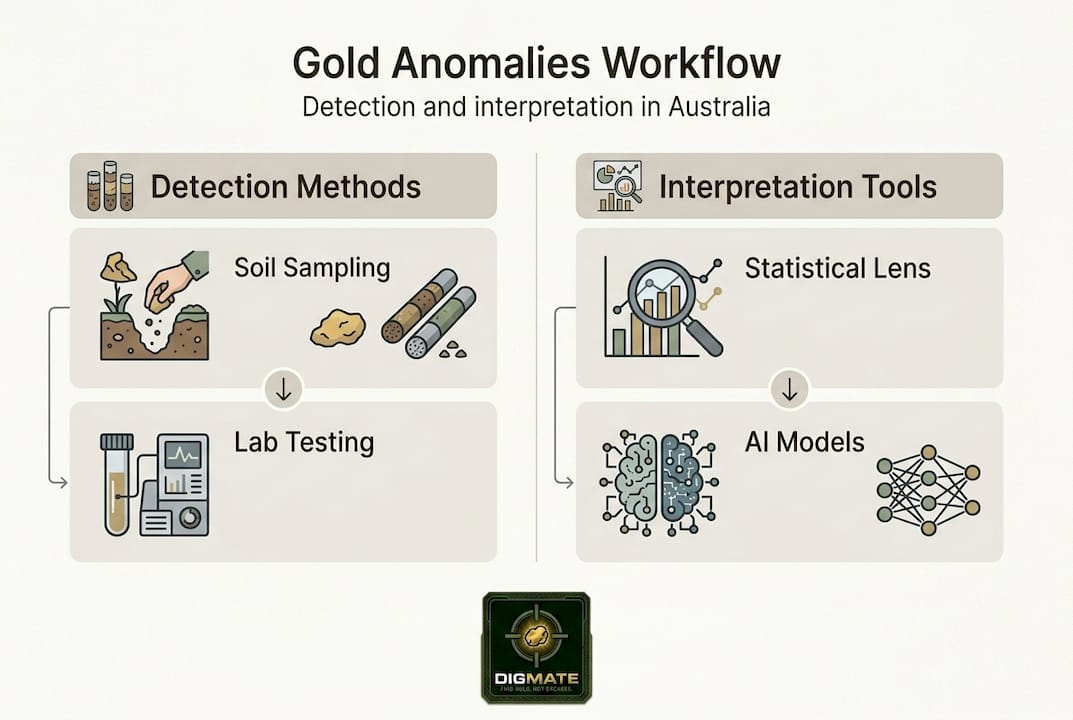
Detection is both a science and a craft. In Australia, the standard workflow combines systematic field sampling, laboratory analysis, and increasingly, computational data processing. Getting any one of these steps wrong can mean you walk past a significant deposit without ever knowing it was there.
Detection thresholds you need to know
Australian exploration relies on specific numeric benchmarks. Here's a straightforward reference:
| Gold concentration level | Threshold (ppb Au) | What it means in the field |
|---|---|---|
| Background | 5 to 10 ppb | Normal, undisturbed soil gold content |
| Initial anomaly | Greater than 25 ppb | Warrants closer follow-up and re-sampling |
| Strong anomaly | Greater than 50 ppb | High priority, especially if spatially consistent |
| High-grade zone | Greater than 100 ppb | Immediate follow-up and potential drill targeting |
In Australian gold exploration, B-horizon soil sampling targets anomalies above 20 to 50 ppb Au, with 25 ppb as the standard initial detection threshold and 100 ppb marking high-grade zones. Anything below 10 ppb in most goldfield terrains is considered background.
The standard detection workflow
Follow this sequence to build a reliable anomaly detection program:
- Design your sampling grid. Grid spacing matters enormously. Standard Australian practice uses 25 to 100 meter spacing depending on terrain and deposit type. Tighter grids cost more but catch subtle anomalies that wider grids miss completely.
- Collect B-horizon soil samples. Depth consistency is critical. Sampling at inconsistent depths introduces significant noise and makes spatial correlation unreliable.
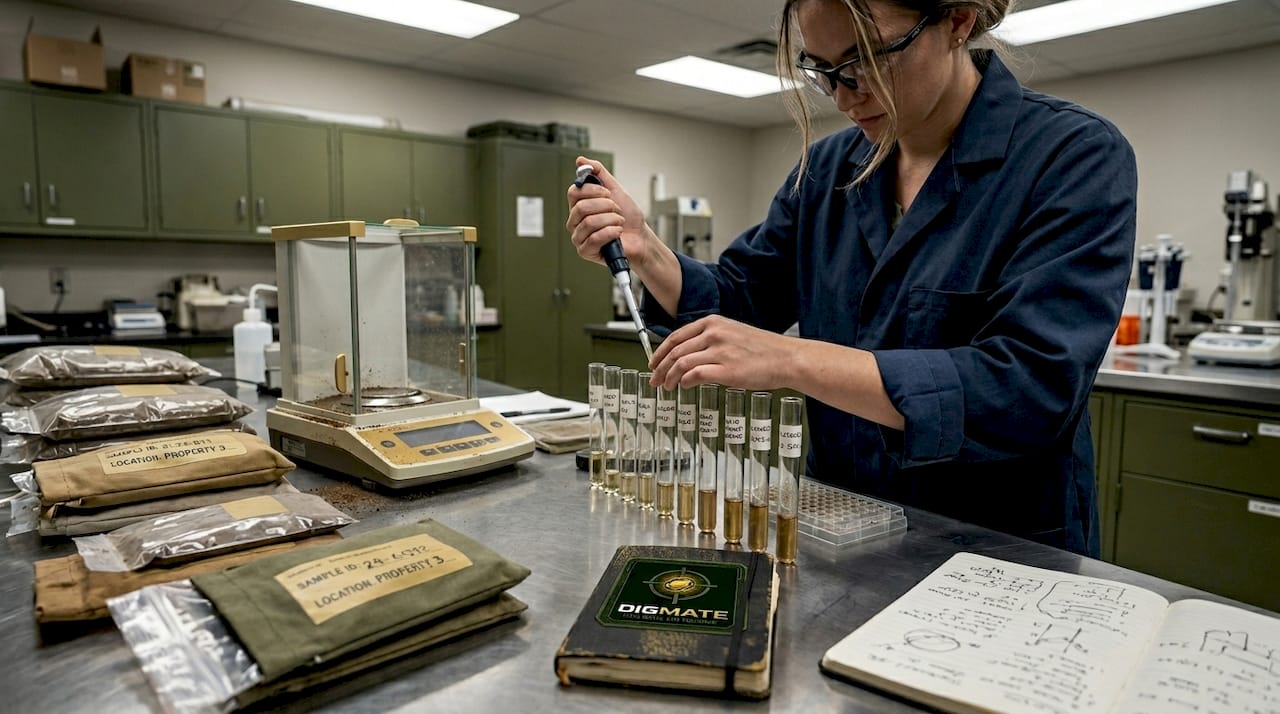
- Submit samples for laboratory assay. Fire assay with atomic absorption spectrometry (AAS) or inductively coupled plasma mass spectrometry (ICP-MS) gives you the precision needed at ppb levels.
- Apply UltraFine+ assay techniques where appropriate. In terrains with thick transported cover, conventional assays miss gold locked in clay-sized particles. UltraFine+ methodology, developed through CSIRO and available via labs like LabWest, dramatically improves detection sensitivity in these challenging environments.
- Screen for pathfinder elements. Gold rarely travels alone. Arsenic and antimony are the primary pathfinder elements in Australian orogenic gold systems. Their presence alongside elevated gold readings is a strong confirmation signal. Multi-element ICP packages add modest cost but dramatically reduce false positives.
- Map and interpret results spatially. Raw data in a spreadsheet tells you little. Plot results on a geographically accurate base map, apply threshold filters, and look for spatial coherence.
Pro Tip: Never rely on a single element screen. Running As and Sb alongside Au costs a fraction of re-sampling a prospect and can save you from drilling a false positive or, worse, abandoning a real one because the gold readings alone looked borderline.
Explore detection methods for alluvial gold and the essential gold detection tools to round out your technical toolkit beyond soil geochemistry.
Interpreting gold anomalies: Statistical approaches and expert insights
Once anomalies are detected, understanding what makes them meaningful is the next challenge.
Raw numbers only get you so far. The real skill in gold anomaly interpretation is knowing which statistical lens to apply and when to trust your geological instincts over the math.
Statistical methods: Old approach vs. modern tools
| Method | Strengths | Weaknesses |
|---|---|---|
| Mean + 2 standard deviations | Simple, widely understood | Fails with skewed, non-normal geochemical data |
| Fractal/multifractal analysis | Handles non-normal distributions well | Requires specialist software and understanding |
| AI/ML (Random Forest, SOM) | Detects complex, weak, or hidden patterns | Needs sufficient training data |
Traditional interpretation uses the mean plus two standard deviations threshold, but fractal and multifractal methods handle skewed geochemical data far more reliably. In gold exploration, data distributions are almost never normal. A single high-grade sample can distort mean values, making standard statistical thresholds unreliable without careful treatment of outliers.
Fractal analysis works by examining how anomaly clusters scale across different spatial resolutions. It's particularly powerful in identifying nested anomaly structures, where a broad low-grade halo surrounds a tighter, high-grade core. Missing that inner core because you only looked at regional-scale patterns is a costly mistake.
The geological context that makes or breaks your interpretation
Statistics without geology is guesswork. The most important interpretive filters include:
- Structural associations: Gold anomalies in Australian goldfields almost always associate with shear zones, faults, or fold hinge zones. An anomaly that doesn't align with any mapped or interpreted structure deserves skepticism.
- Radiometric signatures: Potassium (K) and thorium (Th) highs from airborne radiometric surveys often correlate with hydrothermal alteration zones that host gold. Overlaying your geochemical anomaly against radiometric data adds a powerful validation layer.
- Gravity and magnetic edges: Many high-grade gold deposits in greenstone belts sit on or near geophysical contacts, basement highs, or magnetic lows.
- Positive vs. negative anomalies: In some geological settings, gold deposits sit in structural "traps" that are actually geochemical lows at the surface, because gold is still migrating or has been redistributed. Recognizing these negative anomaly traps requires experience and, increasingly, AI assistance.
AI and machine learning models including fractal analysis, random forest classification, and self-organizing maps (SOM) significantly improve detection in censored and complex datasets. A "censored" dataset is one where many readings fall below the detection limit of the assay method, which is common in low-grade cover terrains.
Pro Tip: When you have a borderline anomaly, plot the edge of the anomaly carefully. Many prospectors drill the peak value, but the highest grade mineralization often sits along the anomaly margin where structural focusing was strongest. The edge is frequently where the money is.
Applying smarter mineral exploration tips alongside solid anomaly interpretation dramatically reduces the odds of drilling dry holes.
Applying gold anomaly knowledge: Prospecting strategies for Australian goldfields
Armed with interpretation tools, let's turn knowledge into actionable prospecting advantages.
Understanding anomalies theoretically is one thing. Knowing exactly how to sequence your response to one in the field is what separates successful prospectors from those who consistently miss out. Here's a practical prioritization and action framework built around Australian goldfield conditions.
Step-by-step anomaly response strategy
- Prioritize large, spatially coherent anomalies first. Size matters in geochemistry. Focus on anomalies greater than 50 ppb that extend over more than 500 meters of strike length in greenstone belt settings. These represent genuine system-scale mineralization potential, not local contamination.
- Validate with UltraFine+ or equivalent high-sensitivity assays. Before committing drill resources, confirm your anomaly using the best available assay technology. If initial samples were run with conventional fire assay, running selected follow-up samples through UltraFine+ often reveals stronger signals in clay-rich cover terrains.
- Screen multi-element pathfinder signatures across the anomaly. Map how arsenic and antimony concentrations correlate spatially with your gold anomaly. A gold anomaly backed by a matching As-Sb footprint has far higher confidence than gold alone.
- Leverage AI tools to analyze your dataset. If you're working with a large grid dataset, run it through an AI-assisted platform before committing to drill locations. Machine learning models frequently identify spatial patterns and anomaly clusters that standard manual interpretation overlooks, particularly in mature or well-tested goldfields where remaining targets are genuinely subtle.
- Target drill holes along anomaly edges, not just peaks. As discussed in the interpretation section, the margins of broad low-grade halos are statistically more likely to intersect high-grade core mineralization than drilling into the geochemical center.
- Reassess and iterate after each drill hole. Every drill result, including dry ones, gives you new information that should feed back into your anomaly model. AI platforms that update predictions in real time based on new data provide a major advantage here.
Pro Tip: In Victoria's goldfields, many brownfields areas have extensive historical assay databases that are publicly available through the Victorian government's GeoVic portal. Feeding that historical data into an AI platform before you even put a boot on the ground can reveal anomalies that were tested with inadequate methods in earlier exploration cycles and then abandoned prematurely.
The best prospecting practices consistently emphasize patience and systematic iteration rather than random drilling based on single elevated readings.
Why AI-powered anomaly detection is a game changer
Here's a perspective worth sitting with: the gold that's easiest to find in Australia has almost certainly already been found. The deposits remaining in mature goldfields like Bendigo, Ballarat, and the Eastern Goldfields of WA are by definition the ones that earlier exploration missed. That means the signals pointing to them are subtle, partially masked by cover, structurally complex, or buried in datasets that were analyzed with tools that weren't up to the task.
This is where most prospectors get the strategy wrong. They're using 2000-era geochemical interpretation approaches on prospects that need 2026-level analysis. AI and machine learning methods including fractal analysis, random forest models, and self-organizing maps are not optional upgrades at this point. They're the baseline requirement for competitive exploration in mature terrains.
What AI specifically does better than human-only interpretation is handle contradiction and complexity simultaneously. It can weigh a borderline gold reading against radiometric data, structural proximity, historic drill results, and pathfinder element signatures all at once. No individual geologist maintains that much information in working memory without losing nuance. Experienced practitioners who understand the role of geology in gold finding and combine that with AI-assisted data analysis are genuinely working at a different level than those relying on spreadsheets and gut feel alone. The first-mover advantage in adopting these methods is still real and still significant.
Take your gold anomaly detection to the next level
Ready to put these insights into action? Here's where to start.
Digmate is purpose-built for Australian prospectors and mining professionals who want to move beyond guesswork. The platform's AI gold prospecting features combine geospatial mapping, multi-element data visualization, and machine learning analysis calibrated to New South Wales and Victorian goldfield conditions.
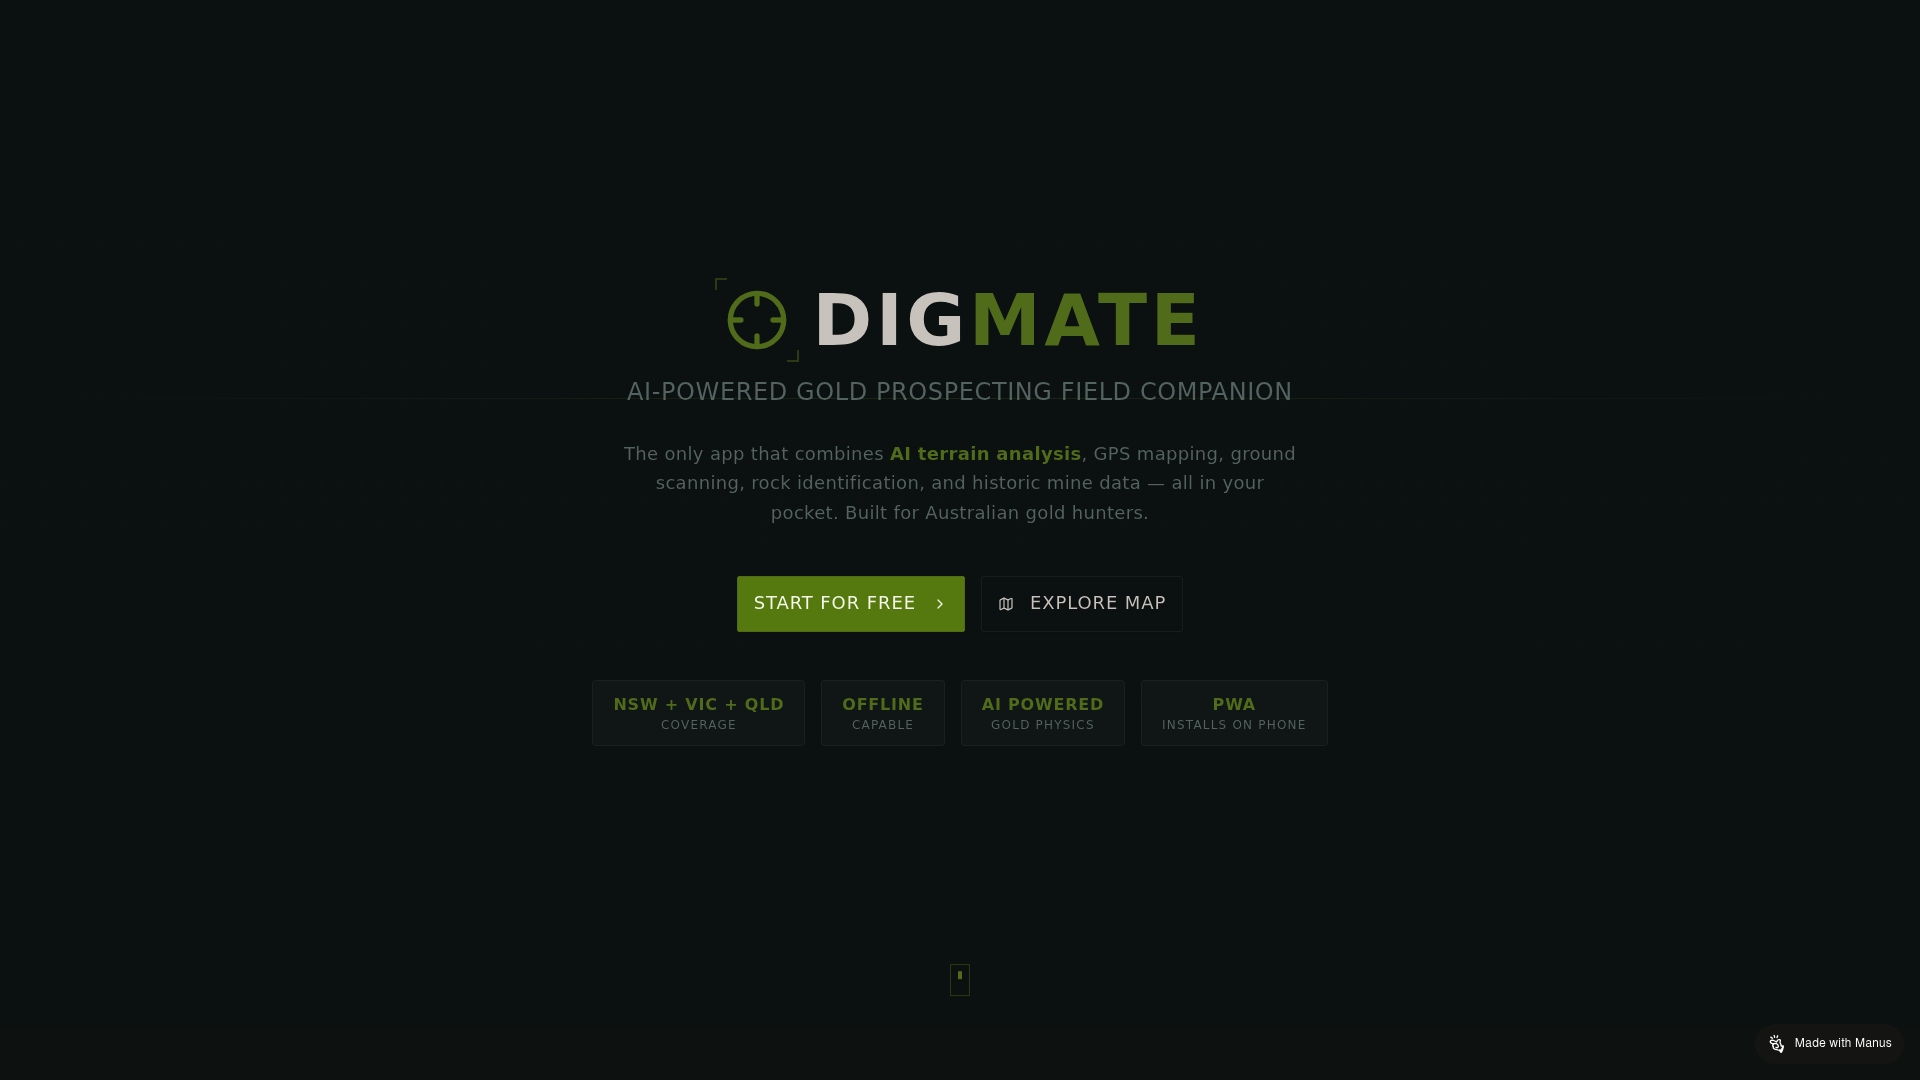
Whether you're running soil sample campaigns in the Bendigo goldfields or evaluating stream sediment results in the New England region, Digmate's ground scan capabilities let you visualize anomaly patterns, apply threshold filters, and identify priority drill targets faster than manual processing allows. Start with the free gold prospecting map to see what AI-powered anomaly detection looks like for your region.
Frequently asked questions
How do you know if a gold anomaly indicates a real deposit?
A gold anomaly signals mineral potential, but confirmation requires follow-up assays, pathfinder element checks, and drilling to verify underlying mineralization. Grid-based sampling and UltraFine+ assaying followed by RC drilling is the standard confirmation pathway in Australian exploration.
What are typical background and anomaly gold levels in Australian soils?
Background is usually 5 to 10 ppb gold in most Australian terrains. Anomalies start above 25 ppb for initial detection, with high-grade zones defined at greater than 100 ppb Au in B-horizon soil samples.
Can AI and machine learning improve the detection of gold anomalies?
Yes. AI and ML methods including random forest, fractal analysis, and self-organizing maps identify subtle patterns in complex or censored datasets that traditional statistical methods regularly miss, especially in mature and covered terrains.
Why are pathfinder elements important in gold anomaly investigation?
Pathfinder elements like arsenic and antimony form as part of the same hydrothermal system that deposits gold. Their presence alongside gold readings confirms mineralization-related anomalies and significantly reduces costly false positives before drilling begins.