Surface sampling and a good eye for country used to be enough. Not anymore. Geodata methods have led to greenfield discoveries and an explosive increase in mapped mining features across New South Wales and Victoria, fundamentally changing what it means to run a serious exploration program. If you're still relying on outcrop observation and historical maps alone, you're leaving real targets buried under cover. This guide breaks down why geospatial data is now the backbone of competitive mineral prospecting, which datasets actually move the needle, and how you can apply these tools to find more in NSW and VIC.
Table of Contents
- How geodata is transforming mineral exploration
- Data sources and technologies prospectors can't ignore
- Turning raw geodata into actionable exploration insights
- Real-world outcomes and expert lessons from NSW and Victoria
- Common pitfalls and how to maximize geodata's value
- Accelerate your mineral discoveries with better geodata tools
- Frequently asked questions
Key Takeaways
| Point | Details |
|---|---|
| Geodata expands potential | Using integrated geospatial data opens new exploration targets, especially under cover, increasing discovery potential in NSW and Victoria. |
| Technology choices matter | Matching the right geodata type—such as hyperspectral or LiDAR—to your project's needs delivers more detailed and actionable mineral insights. |
| Smart processing boosts results | Careful data gridding, integration, and ground validation turn raw data into effective prospecting decisions and reduce costly errors. |
| Data-driven workflows win | Case studies from NSW and Victoria show that prospectors using modern geodata consistently achieve greater mapping accuracy and more new discoveries. |
How geodata is transforming mineral exploration
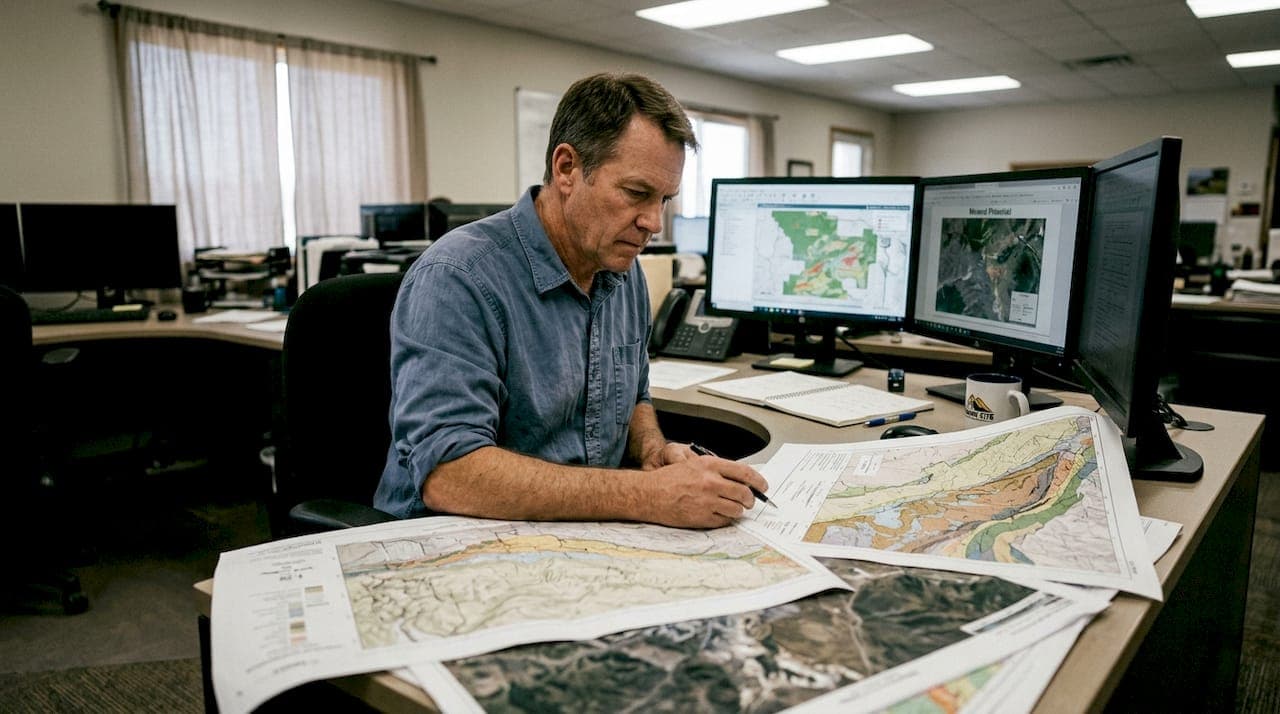
Geodata is not a single tool. It's a family of spatially referenced datasets that, when layered together, give you a picture of the subsurface that no amount of surface walking can replicate. The core datasets include gravity, magnetics, electromagnetic (EM), radiometrics, hyperspectral imagery, and LiDAR. Each one captures a different physical or chemical property of the earth, and each one tells a different part of the story.
The real power comes from integration. Geospatial data enables integration of gravity, magnetics, EM, and radiometrics for mineral systems analysis in NSW and VIC, giving exploration teams a layered view of entire mineral systems rather than isolated anomalies. Load these datasets into a GIS platform and you can cross-reference structural controls, alteration zones, and geophysical signatures simultaneously.
This matters most in covered terrains, which describe most of productive NSW and VIC. Regolith, sediment, and vegetation hide the very features you're hunting. Geodata extends your reach beneath that cover, letting you model what's happening at depth without drilling a single hole.
Here's what that integration actually enables:
- Rapid identification of structural corridors that host gold and base metal mineralization
- Detection of alteration halos invisible at the surface
- Prioritization of drill targets before committing capital
- Reduction of missed opportunities in areas previously written off as barren
"Expanding the search space and integrating different data types makes for fundamentally better site selection." This principle drives every successful geodata-led program in the region.
For prospectors ready to move beyond guesswork, sophisticated geodata analysis is now accessible at a scale that was previously reserved for major mining companies. The Southern Thomson Project is a clear example of how regional geodata programs unlock entirely new prospective areas.
Data sources and technologies prospectors can't ignore
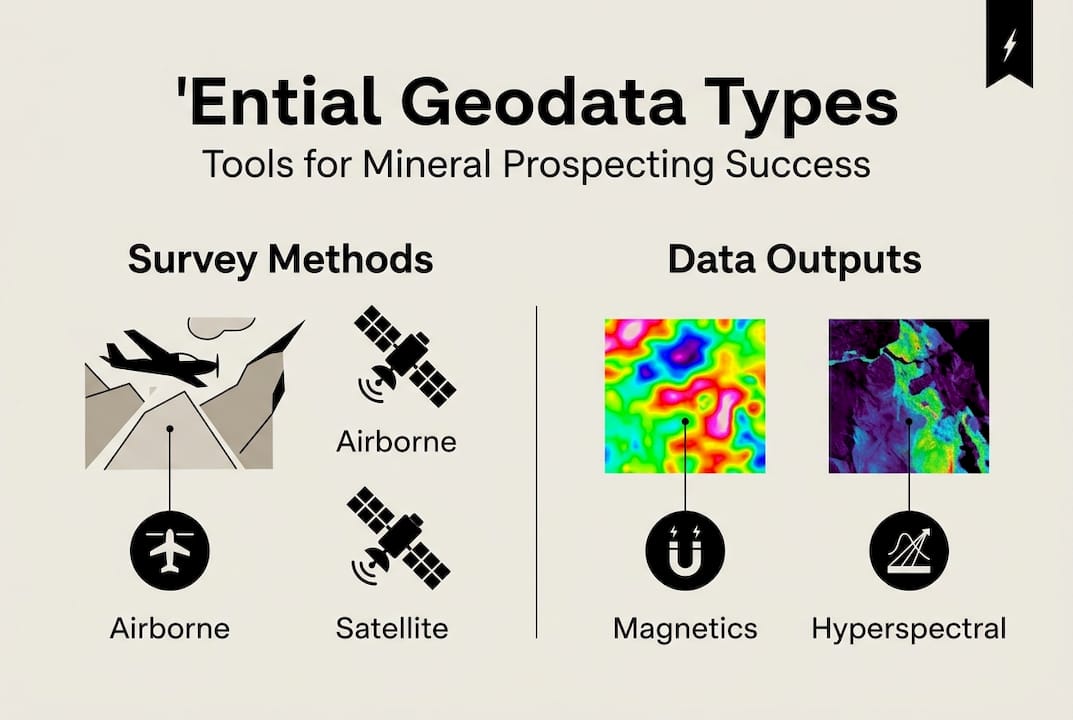
Not all geodata is created equal. The technology you choose should match your exploration stage, your terrain, and the mineral system you're targeting. Here's a breakdown of the main survey types and what they deliver.
| Data type | Spatial resolution | Depth penetration | Primary use case | NSW/VIC example |
|---|---|---|---|---|
| Airborne gravity | Medium | Deep crustal | Basin architecture, cover thickness | Southern Thomson Project |
| Airborne EM | High | Shallow to mid | Conductive targets, cover mapping | Stavely Project (VIC) |
| Hyperspectral imagery | Very high | Surface/near-surface | Alteration mapping, mineral ID | PRISMA/EnMAP surveys, NSW |
| LiDAR | Very high | Surface only | Structural mapping, feature detection | Golden Plains, VIC |
| Magnetotelluric (MT) | Low to medium | Very deep | Deep crustal structure | Southern Thomson |
Hyperspectral satellite imagery processed into mineral abundance maps has enabled greenfield discoveries across NSW and VIC, identifying alteration assemblages that direct field teams straight to the right ground. Meanwhile, airborne EM and gravity surveys model cover thickness and mineral potential across large areas efficiently.
Here's a practical workflow for selecting your data sources:
- Define your target mineral system and the geophysical signature it produces.
- Assess terrain and cover type to determine which sensors can penetrate effectively.
- Check existing public datasets before commissioning new surveys.
- Layer complementary datasets to build a multi-evidence target.
- Rank targets by convergence of anomalies across multiple data types.
Pro Tip: Most prospectors underutilize hyperspectral data because it looks complex to process. Start with pre-processed mineral abundance products from CSIRO or Geoscience Australia before investing in raw scene processing. You'll get actionable alteration maps without needing a remote sensing specialist on staff.
Turning raw geodata into actionable exploration insights
Acquiring data is the easy part. Converting it into a ranked list of drill targets is where most programs either succeed or stall. The workflow from raw acquisition to actionable insight follows a clear sequence, but each step has traps.
The core processing chain looks like this:
- Data acquisition: Airborne, satellite, or ground-based collection.
- Quality control: Remove noise, correct for terrain and instrument drift.
- Gridding and interpolation: Convert point or line data into continuous surfaces.
- Enhancement and filtering: Apply band ratios, derivatives, and edge detection.
- GIS integration: Layer processed grids with geology, structure, and historical workings.
- Prospectivity modeling: Score cells by multi-criteria analysis to rank targets.
Combining and gridding data at appropriate cell sizes is essential for accurate continuous visualization and prospectivity mapping. Cell size is one of the most underappreciated decisions in the entire workflow. Too coarse and you smooth out the subtle anomalies that mark small but high-grade targets. Too fine and you amplify noise until the signal disappears entirely.
A practical rule: set your grid cell size to roughly half the line spacing of your airborne survey. For regional reconnaissance at 200-meter line spacing, a 100-meter cell works well. For detailed follow-up at 50-meter spacing, drop to 25 meters.
The stratigraphic drilling in Southern Thomson demonstrated how integrating gravity, EM, and seismic data at matched resolutions produced a coherent basin model that guided targeting far more effectively than any single dataset alone.
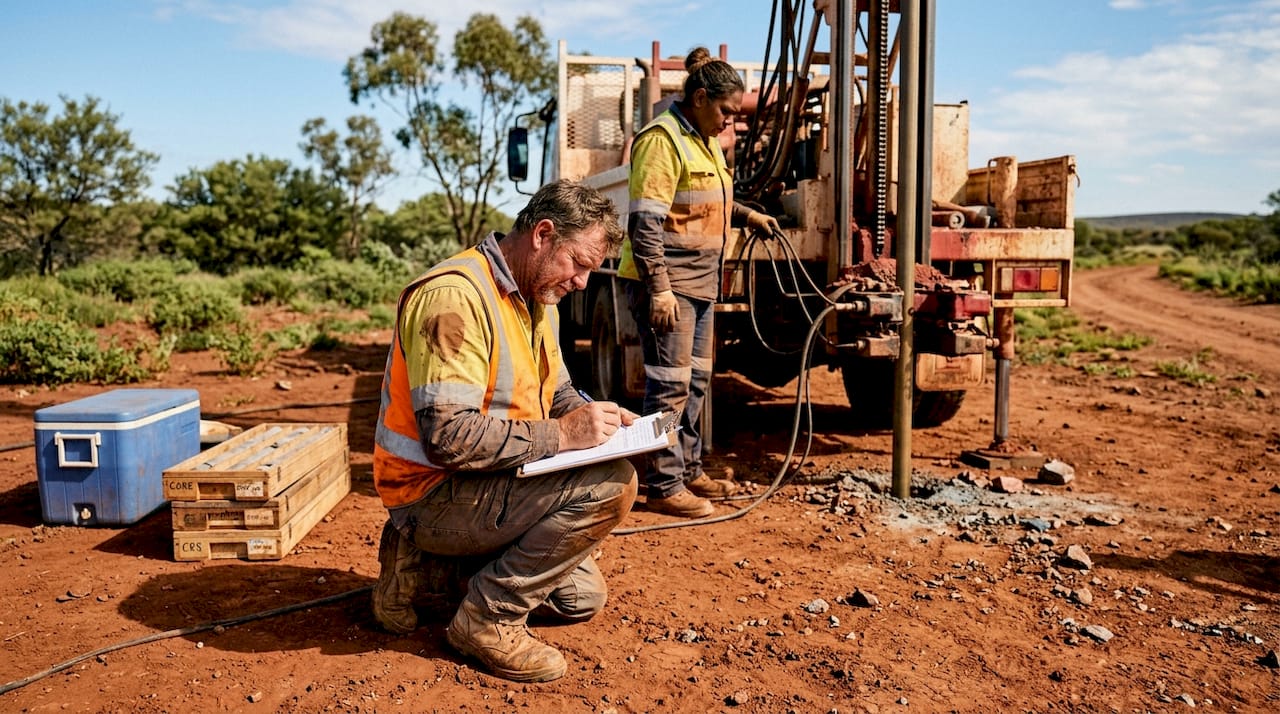
Pro Tip: The most overlooked step is post-processing validation. Before you act on a geophysical anomaly, cross-check it against at least two independent data types and, where possible, collect a ground truth sample. One strong anomaly in a single dataset is a lead. Three converging anomalies from independent sources is a target.
Real-world outcomes and expert lessons from NSW and Victoria
Theories and workflows matter, but nothing drives the point home like regional results. The numbers from NSW and VIC are striking.
In Victoria's Golden Plains district, LiDAR automated detection identified 74,430 new mining features compared to fewer than 2,000 mapped by traditional methods. That's a 38x increase in mapped features from a single technology applied to a well-explored region. Features that had been invisible to field teams for decades became obvious the moment LiDAR data was processed and visualized correctly.
In NSW, hyperspectral satellite mapping identified new mineral zones in areas previously considered low priority. ASTER and airborne gravity surveys directed field teams to targets that conventional mapping had missed entirely, resulting in direct new discoveries.
The lesson from both case studies is consistent: geodata-led greenfield mineral discoveries are not a product of luck. They're a product of systematic, multi-source data integration applied to the right questions.
Here's what prospectors operating in NSW and VIC have learned from going geodata-first:
- Historical workings are a starting point, not a boundary. LiDAR and hyperspectral data routinely reveal prospective ground adjacent to known deposits.
- Cover is not a barrier. EM and gravity surveys routinely model mineralization beneath 50 to 200 meters of regolith.
- Multi-source convergence is the strongest signal. A gravity low coinciding with an EM conductor and a hyperspectral alteration zone is worth drilling. One anomaly alone is not.
- Speed matters. Geodata-first programs reach drill-ready targets faster than traditional programs, compressing the timeline from license grant to discovery.
Common pitfalls and how to maximize geodata's value
Even experienced teams make avoidable mistakes with geospatial data. Knowing where programs go wrong is as valuable as knowing the best practice.
The most common pitfalls include:
- Over-reliance on a single dataset. Magnetics alone will not find everything. Neither will EM. Neither will hyperspectral. The value is in the combination.
- Ignoring cell size and spatial parameters. Failure to account for cell size in gridding or to cross-validate multi-source data can obscure potential discoveries entirely.
- Skipping ground validation. Remote data identifies candidates. Ground truth confirms them. Skipping this step leads to expensive dry holes.
- Poor data quality control. Noisy or uncorrected data produces false anomalies. The hidden cost of poor QC is not just wasted processing time. It's missed targets and drilled duds.
- Treating geodata as a one-time exercise. The best programs iterate. Each survey result refines the model for the next round.
For teams working with tighter budgets, CSIRO mineral analysis resources and open-source platforms provide a strong foundation without heavy capital outlay.
Pro Tip: QGIS is free, powerful, and handles most of the raster and vector analysis you need for a serious prospecting program. Pair it with publicly available Geoscience Australia datasets and you have a competitive analysis environment at near-zero cost. The barrier to entry for geodata-driven prospecting in NSW and VIC has never been lower.
Set clear data objectives before you start processing. Know what mineral system you're targeting, what geophysical signature it produces, and what resolution you need to detect it. Programs that start with clear objectives extract far more value from the same datasets than programs that process everything and hope something stands out.
Accelerate your mineral discoveries with better geodata tools
Understanding geodata principles is one thing. Having the right platform to act on them quickly is another. The gap between knowing which datasets matter and actually turning them into ranked, field-ready targets is where most prospectors lose time and money.
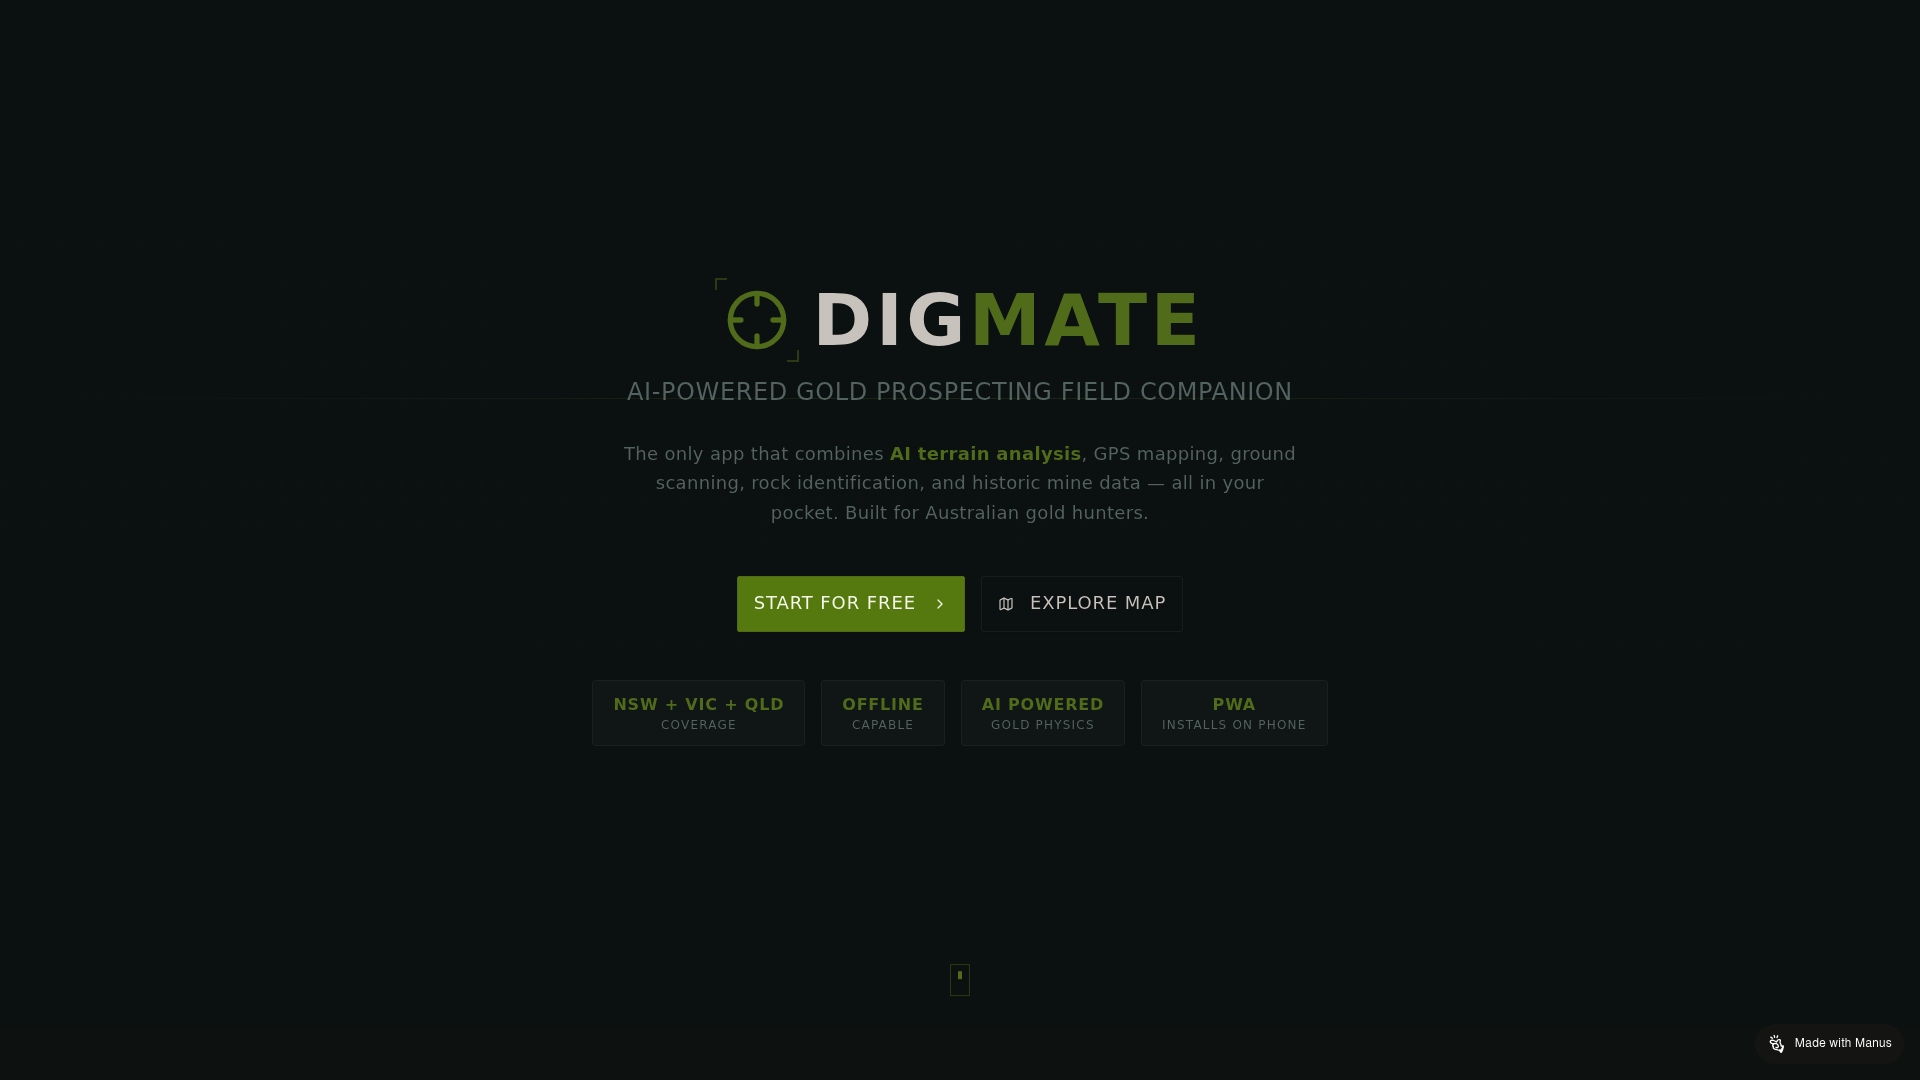
DIGMATE geodata tools are built specifically for prospectors and exploration companies operating in New South Wales and Victoria. The platform combines AI-driven algorithms with integrated geospatial datasets and mapping tools, giving you the analytical power of a full exploration team in a single, accessible interface. Whether you're a solo prospector prioritizing your next field trip or a company refining a regional target list, DIGMATE translates complex geodata into clear, actionable site intelligence. Stop leaving discoveries buried under cover and start prospecting with the data advantage that modern exploration demands.
Frequently asked questions
How does geodata reduce the risk of mineral exploration?
Geodata reduces exploration risk by expanding the search space beneath surface cover and integrating multi-source datasets, which improves targeting accuracy and lowers the chances of committing capital to the wrong ground.
What is the difference between airborne and satellite geodata in mineral prospecting?
Airborne surveys deliver high-resolution subsurface data including EM and gravity responses at depth, while hyperspectral satellite imagery provides wide-area mineral mapping from space, identifying surface and near-surface alteration assemblages across large regions efficiently.
Why is cell size important in geophysical data gridding?
Proper gridding and cell size selection is critical because too large a cell smooths out subtle anomalies while too small a cell amplifies noise, and both errors degrade the accuracy of your prospectivity interpretation.
Can public geospatial data be used cost-effectively by smaller prospectors?
Yes. Satellite imagery and LiDAR in QGIS enable detailed mineral analysis using free, publicly available datasets from Geoscience Australia and CSIRO, making advanced geodata prospecting accessible without significant upfront investment.